Stephen Curry is the greatest shooter in the history of the National Basketball Association.
Given that there have been about 3500 players in the history of the NBA since its inception on 6 June 1946, New York – this is quite a remarkable feat. Every time Curry throws the ball up to the basket, it has a higher percentage chance of going in than any other players in the history of the game. Let that sink in for a moment. Excuse the pun.
How is this possible? One explanation is that he was built in a laboratory and programmed to be a mobile artillery unit with his exceptional shooting ability. But, as we know, that is not possible (at least yet). The Golden States Warriors Steph Curry has been blessed with two big gifts. The first is his natural basketball abilities; coming from a long line of NBA players and shooters (His dad Dell Curry is one of the greatest shootest of basketball as well, and his brother Seth Curry). The second is he launched his career at just about the time data analytics really took the NBA by storm.
Over the last decade, the NBA has looked very different from how it looked, and this can be primarily attributed to Steph Curry and data models. As Bill Gates famously wrote in his essay in 1996 “Content is King”. Well in the modern-day NBA, the three-point shot is King and the person that wears that crown by a country mile is Steph Curry.
As of 2009, the NBA started using video technology to track ball and player movement. Through the combination of this and a few hires of data scientists within NBA teams, the league has moved towards a more evidentiary-based strategy largely based on data. The team that seems to have understood this best is the Golden State Warriors, who have won three championships in the last six years.
For example, in 2012, teams on average only took 18.4 three-point shots per game. Fast forward to the 2019-2020 season, and it is at 31,9 shots per team. The team with the lowest number of three-pointers is the Indiana Pacers at 25.6, which is still much higher than that average in 2012. During this same period, Steph Curry became a three-time champion, two time MVP (first unanimous MVP in 2015), and led the NBA five seasons in three points scored.
This graph developed by shot tracker best illustrates the increase in three points taken:

The Math behind why this works is really simple. Really smart people in the Golden State Warriors realised very early on that they had a special player in Steph Curry, but his star really rose when he started to attempt more three-point shots per game, and also from areas on the court where he statistically was more likely to score.
Adam Fromal of the Bleacher Report breaks it down quite nicely.
“Take the player’s points per shot on three-point attempts and subtract the league-average points per three-pointer during the relevant time period. Then, multiply by the number of attempts.
“If a player shoots 45 percent on 100 threes, he’s getting 1.35 points per attempt. Say the league average is 35 percent or 1.05 points per attempt. The shooter is 0.3 points above average per attempt. Multiply that by the 100 attempts, and you’d have 30 points above average.”
After this formula is applied to Steph Curry, his numbers are astronomically better than anyone close to him.
Okay, so how did Steph Curry actually change the game?
Data analytics can only tell us a bit of the story, but not its entirety. That’s why it is important to understand data within context. Based on the above, it might be conceivable to encourage NBA players to shoot as many three points as they can in a game. After all, after Curry’s 699 games he has played in his career, he made 2,493 3-pointers – the most made in a player’s first 700 games.
It is true that he has made the most three-pointers in the era where the shot became really popular. So, it will be interesting to see what will happen in the next 15-20 years with the advancement of data analytics and models in the game.
Based on the above, should teams take more three points? The data certainly points to it, because there is a correlation of attempted threes and winning percentage at .47, the highest there has ever been in the history of the league. However, the equation of more shots = greater winning is far too arbitrary. There is a reason why it has worked for Steph Curry and the Golden State Warriors. It boils down to efficiency as well – indeed, at 43,5% career average he has a higher chance of making it more than any other player.
But his average plugs into a larger team strategy. Take a look below a chart by Kirk Goldsberry of Curry’s 2015-16 season:
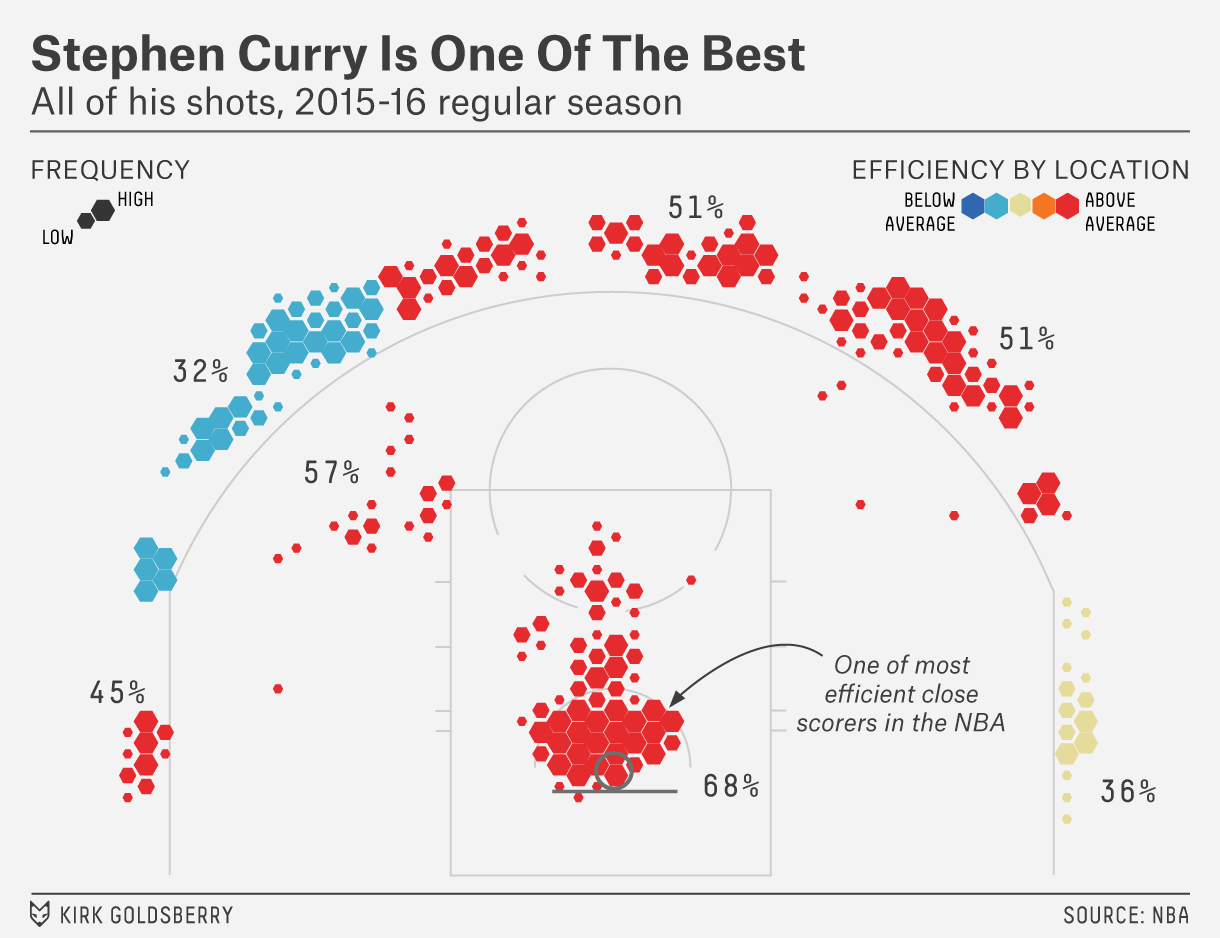
There is a clear indication of where Steph Curry is most efficient and where he is not. Of course, other teams have access to this data – and that’s where data and strategy goes hand-in-hand. Coaches, teams and players in the Golden State Warriors organisation do their best to create isolation players for Curry so that he can operate from these places; coupled with his great shooting ability.
That’s exactly the point. Carly Fiorina of Hewlett-Packard places Curry’s use of data perfectly: “The goal is to turn data into information, and information into insights”.
The “so what”
You may be wondering what’s the point of all the data analytics and obsession with numbers. Well? The number is $4.3 billion as estimated by Forbes, which is the value of the Golden State Warriors currently. In 2010, just about the time Curry started to make a name for himself, the franchise was worth $450 million.
Curry does not play in isolation and is assisted by hall-of-fame players. But a lot of credit has to go to him, and the Golden State Warriors for turning data into smart strategy.